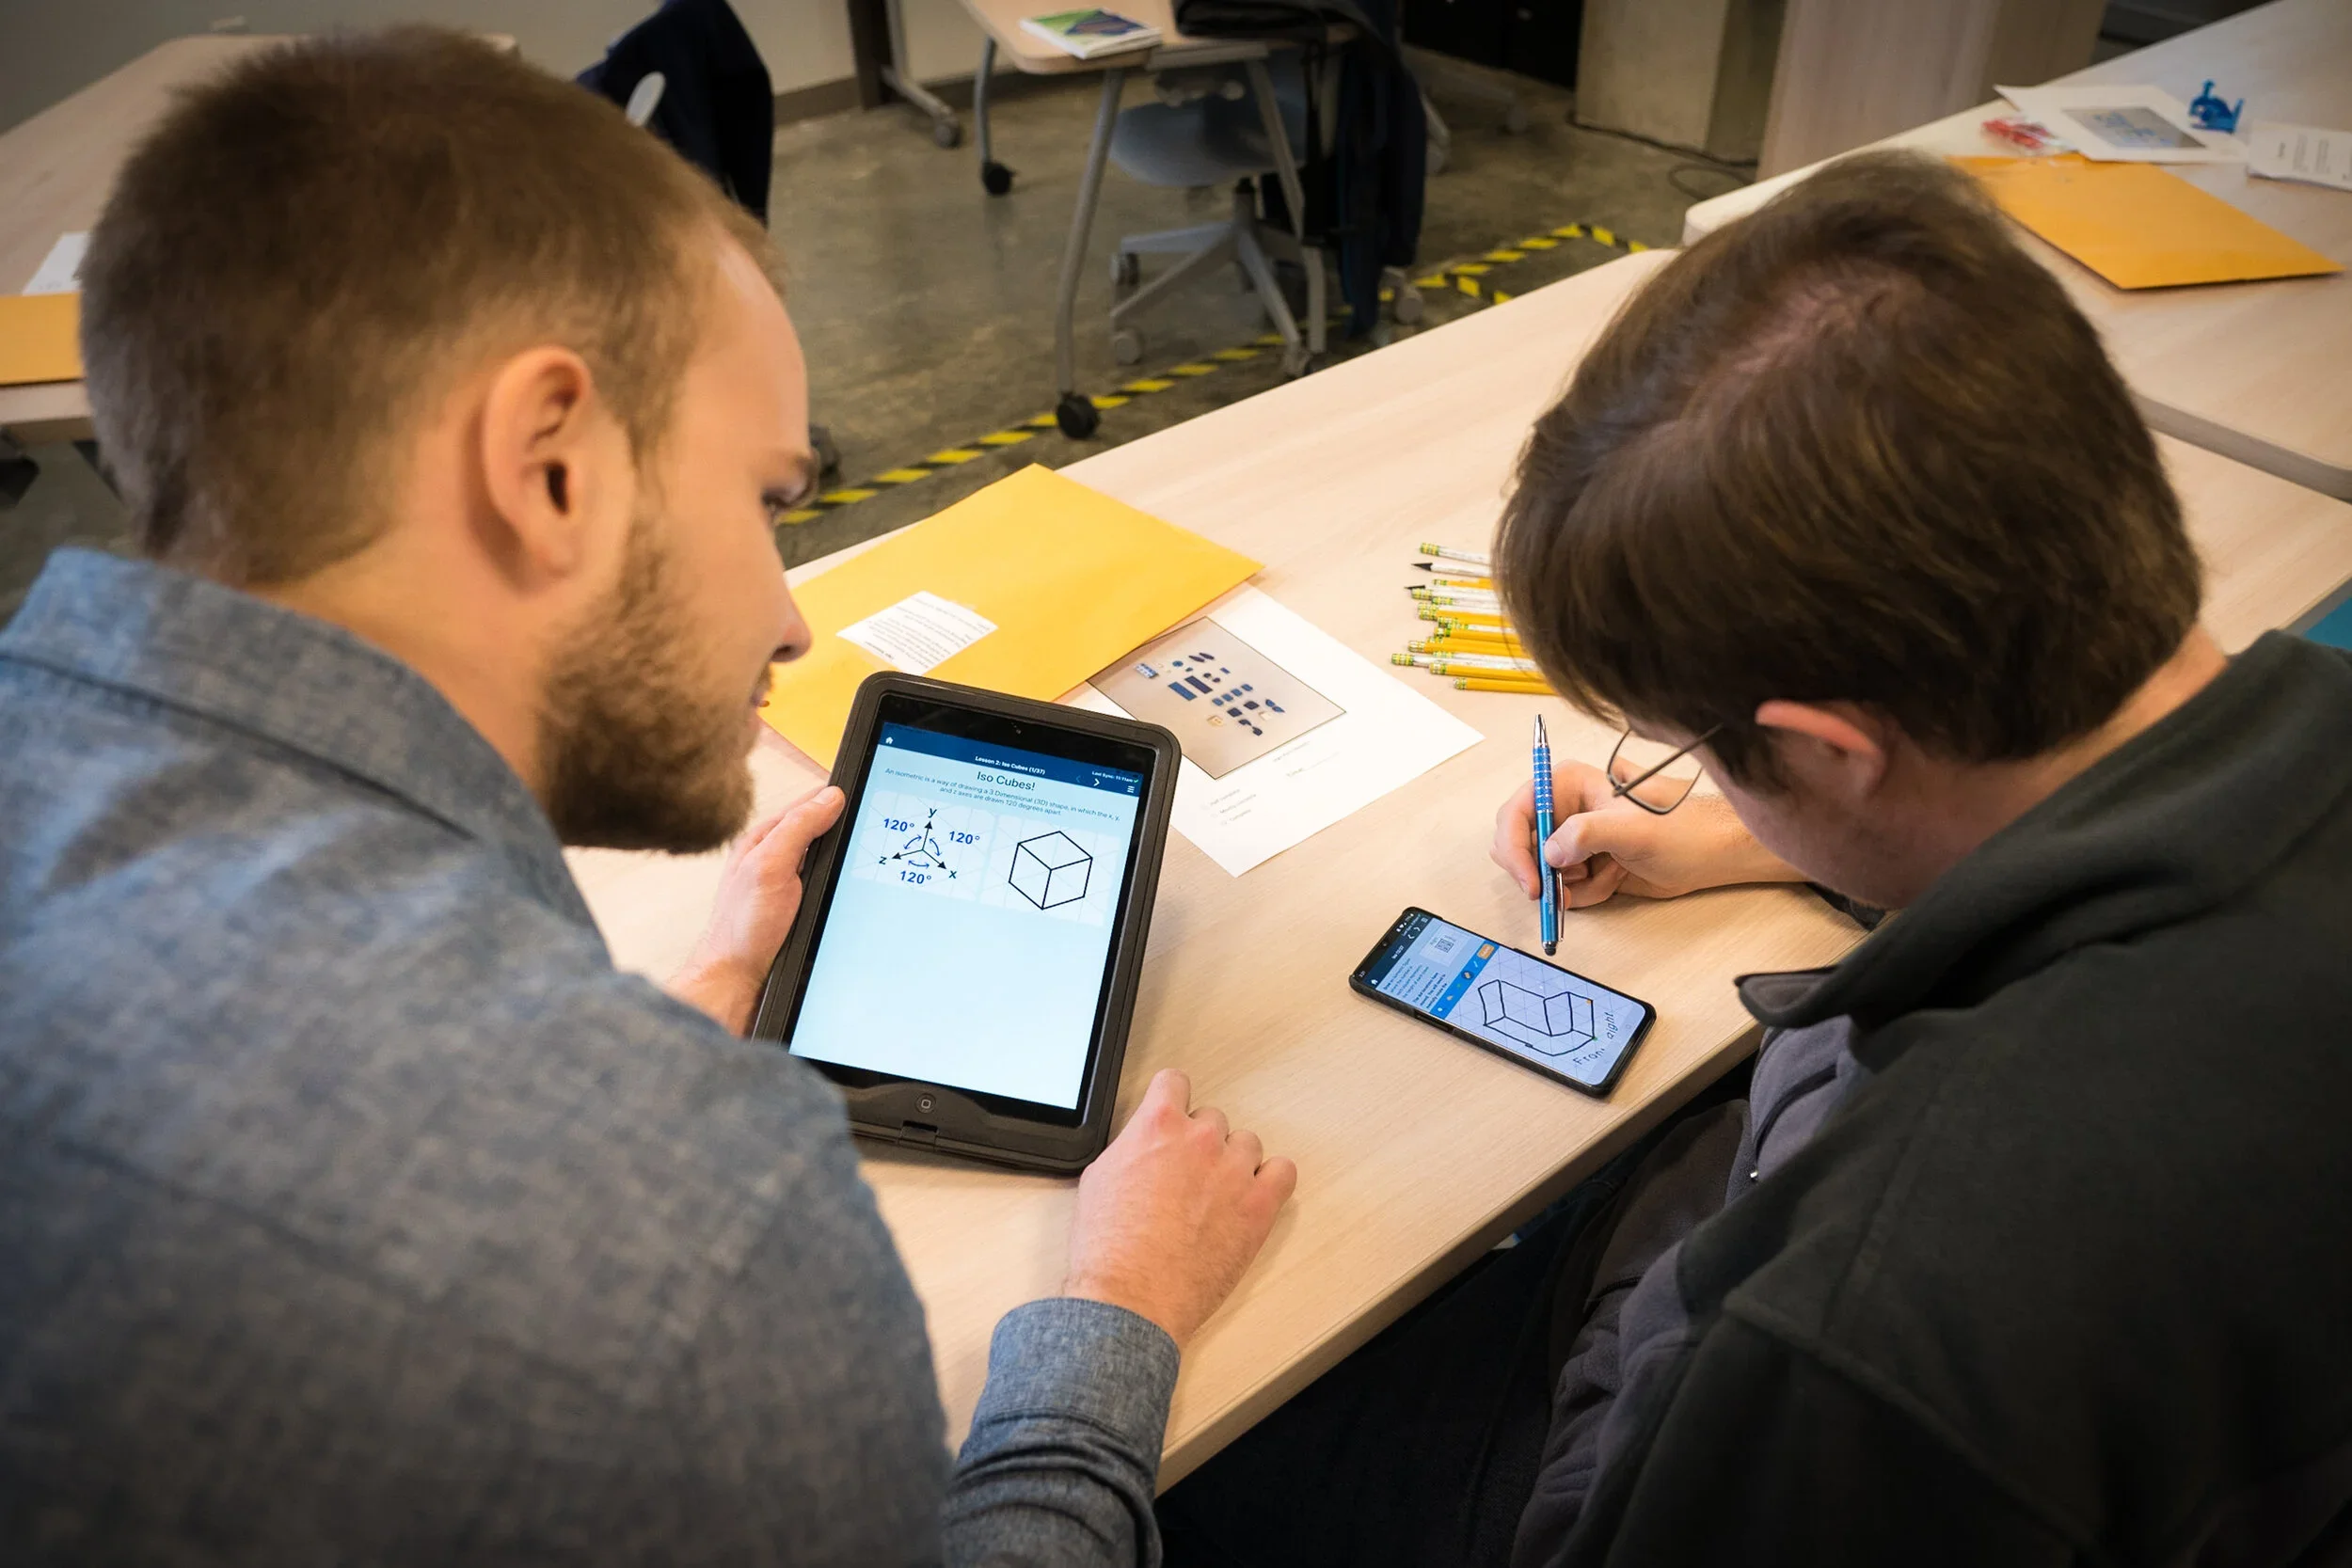
Case 1: Designing for Productive Persistence
How I redesigned Spatial Vis to encourage students to keep trying, use help strategically, and ultimately improve learning outcomes.
Background
Teaching spatial skills through digital sketching
Spatial visualization is the ability to mentally represent and manipulate two dimensional and three dimensional objects. It is a learnable skill that has been associated with success and retention in STEM.
Traditional spatial visualization training often relies on hand sketching exercises that require instructors to grade student work manually. Spatial Vis was designed to bring that practice to a device, allowing students to sketch directly in the application, submit their work for automatic grading, and receive immediate feedback.
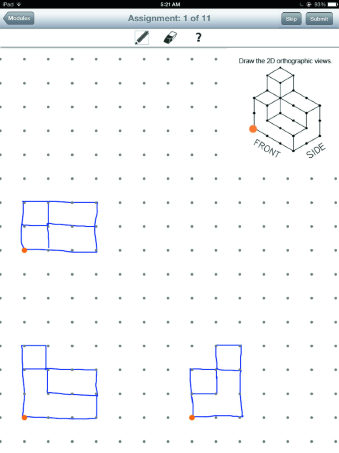
2014 Spatial Vis Interface
My Role: Sole UX Researcher and UI Designer
Responsibilities: User Research · Data Analysis · Interaction Design · UI Design · Usability Testing
Outcome:
46% → 82%
Students demonstrating significant improvement
18% → 39%
Average pre/post test improvement
The Challenge
Why were some students improving while others weren't?
Our initial classroom pilot produced a puzzling result. While some students showed substantial improvement in spatial visualization, nearly half showed little or no improvement.
In 2014, students improved their standardized spatial visualization test scores by an average of 18%, but only 46% of students demonstrated significant improvement.
Rather than treating this variation as an expected difference between students, I wanted to understand whether their behavior within Spatial Vis could help explain the difference.
What were successful students doing differently?
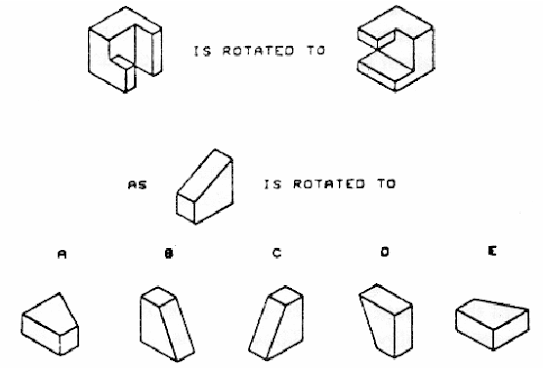
Standardized Spatial Visualization Pre and Post Test
Investigating Student Behavior
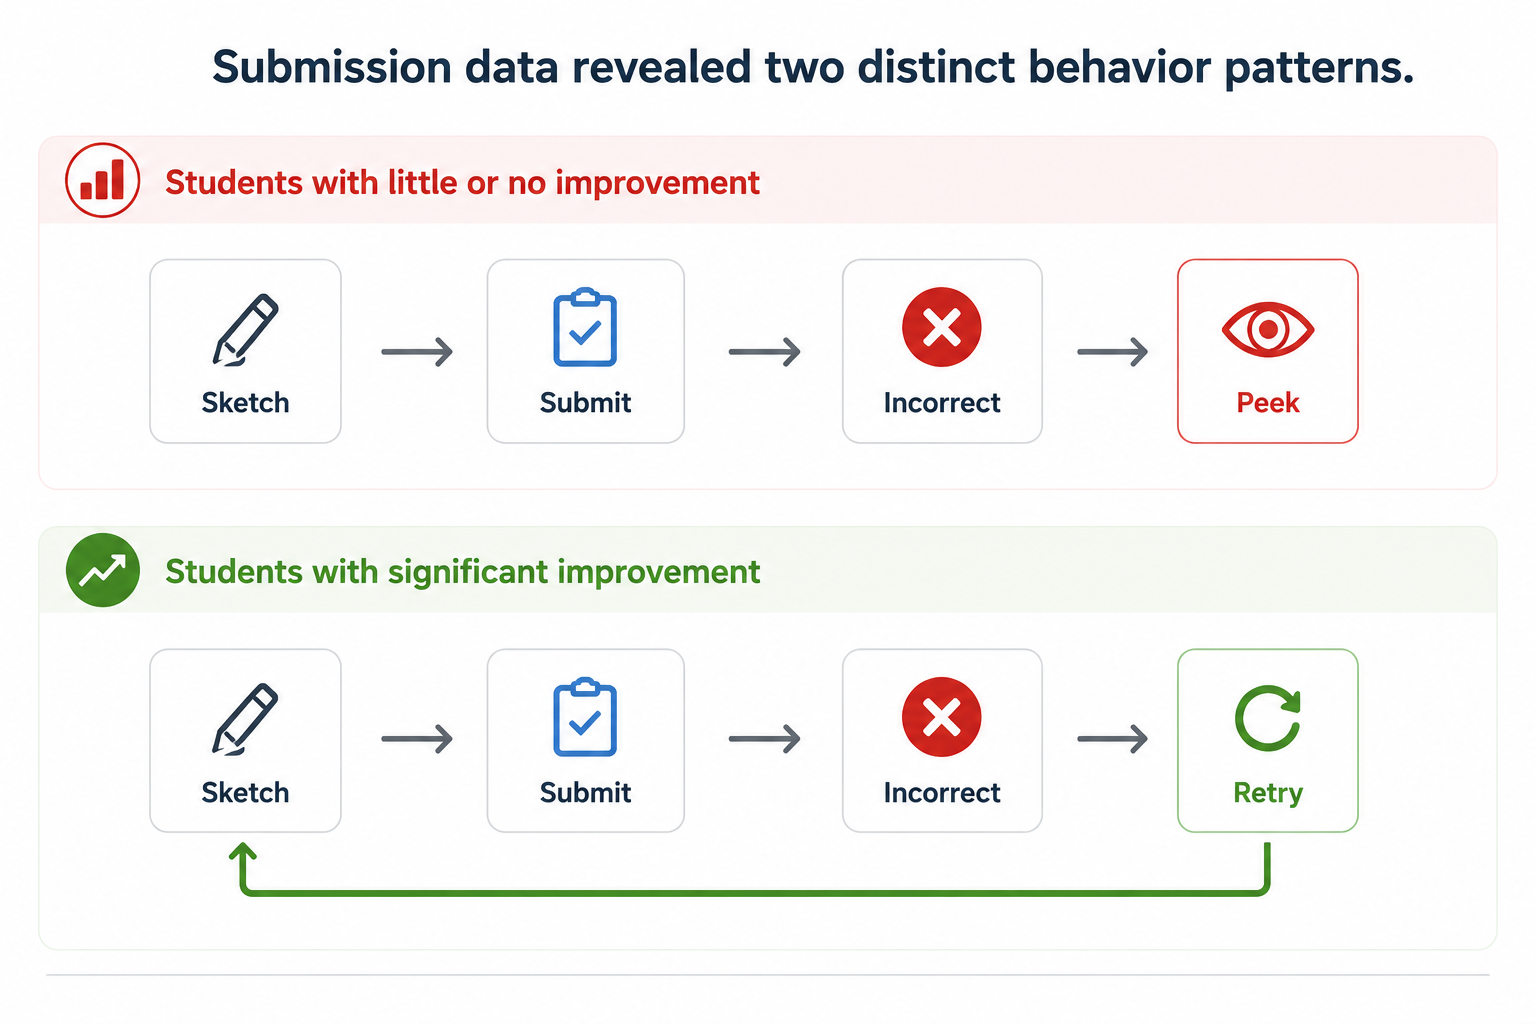
Submission data revealed a pattern.
The team analyzed students' submission patterns and compared the behavior of students who demonstrated significant improvement with those who showed little or no improvement.
A clear pattern emerged.
Students who improved significantly tended to retry assignments repeatedly without using the available help features. Students who showed little improvement tended to use help features much earlier.
The Design Opportunity
Could the interface encourage the behaviors associated with better learning outcomes?
The data suggested that persistence was important, but we didn't want to simply remove help. Students still needed scaffolding when they became stuck.
Instead, I wanted to create a system that encouraged students to try independently first, provided progressively stronger support when needed, and rewarded persistence without penalizing mistakes.
Designing a Help Hierarchy
Gamification with an instructional purpose
I redesigned the help experience around three levels of support and introduced a star system to encourage independent problem solving.
Unlimited attempts. No penalty.
Students could revise and resubmit a sketch as many times as they wanted. Because sketching allows students to make meaningful changes with every attempt, we deliberately chose not to penalize incorrect submissions.

Guidance without revealing the solution.
Hints helped students determine whether they were on the right track while still requiring them to solve the problem themselves. Using a hint cost one star.
Stronger assistance when students were stuck.
Peek provided substantially more information about the solution and therefore cost two stars.
Going Beyond Gamification
The data also revealed opportunities to improve the curriculum itself.
Gamification addressed how students approached challenging assignments, but I also wanted to understand where and why students were getting stuck.
I analyzed submission data to identify assignments that required an unusually high number of attempts. For these outliers, I reviewed and coded students’ first and second submissions to look for recurring patterns and common mistakes.
These patterns helped identify areas where students needed additional scaffolding. Based on the findings, we added intermediate assignments and targeted tutorial content to address common misconceptions and help students build the skills needed for more challenging problems.
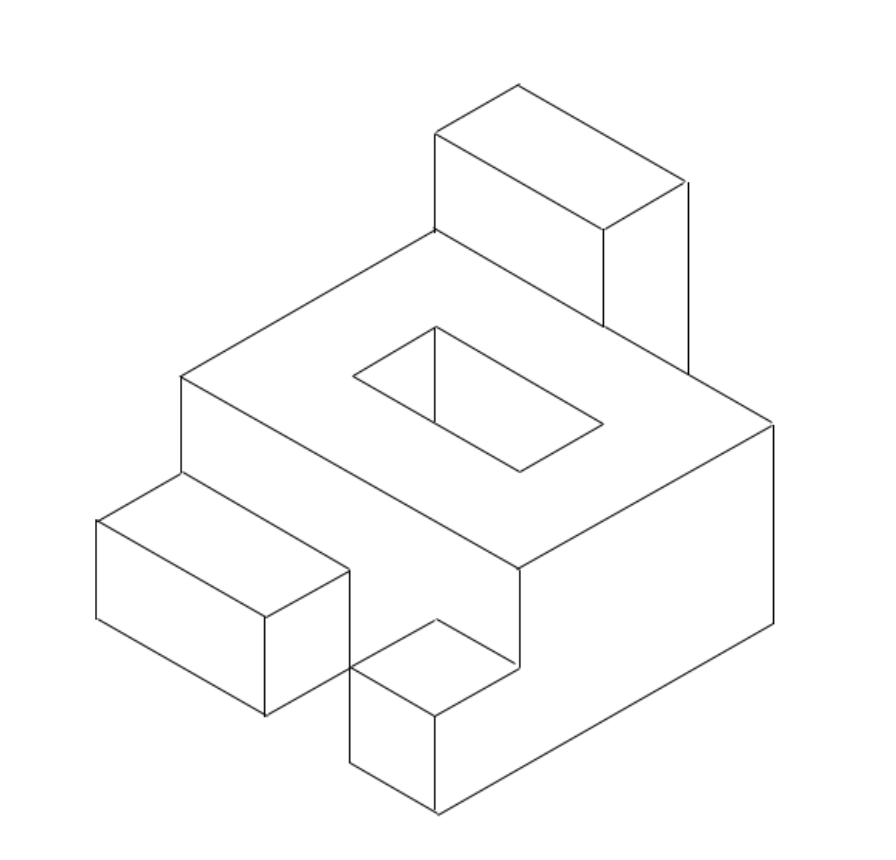
Example: one assignment averaged 5.48 attempts, with 86% students getting it wrong on their first try. Most understood the underlying concept but struggled with which lines should be drawn.
Change: We added more scaffolding assignments to build up to the difficulty of this assignment.
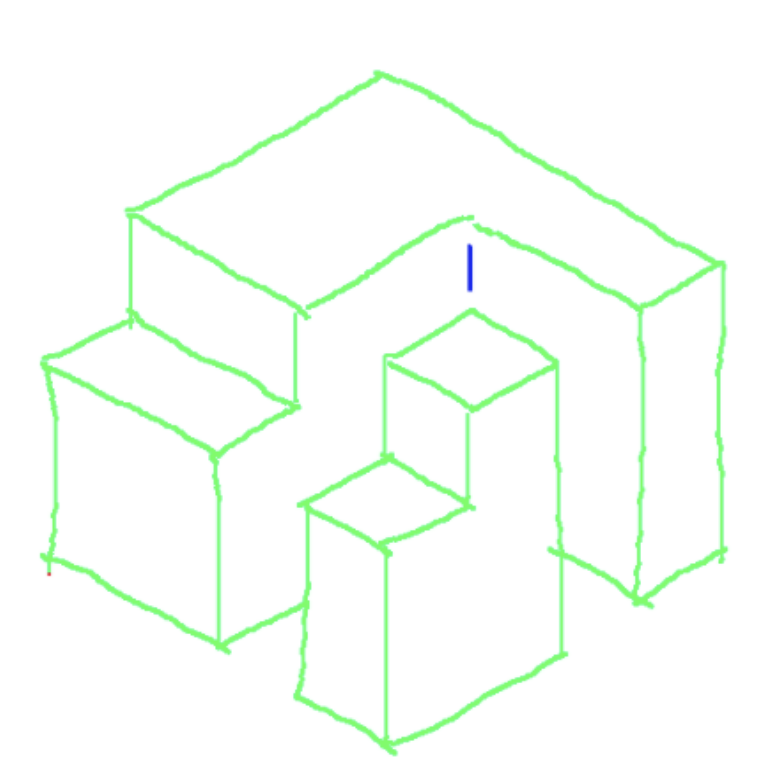
Example: Many students would forget the minor detail line (shown in blue). This could be due them not noticing the line because it blends in with background grid.
Change: We adjusted the assignment by lowering the front island to make the minor detail line a little longer and more noticeable.
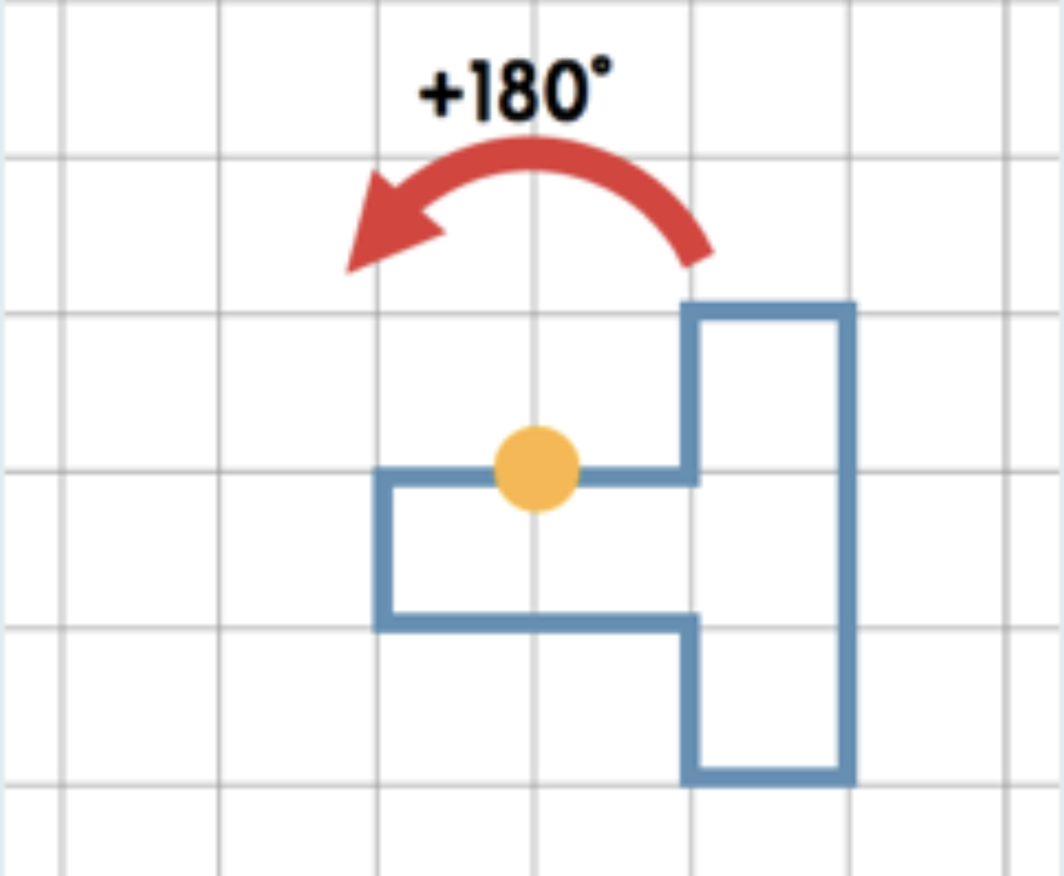
Example: Many students would flip a 2D 180° rotation assignment instead of rotate the shape about the pivot point.
Change: We added a rotation animation to the tutorial and removed any assignments that coincidentally were correct if the student flipped or rotated.
Measuring the Outcome
Student outcomes improved substantially.
Following the redesign, including the new help and reward system, additional instructional scaffolding, and improvements to individual assignments, student outcomes increased substantially. Average pre/post spatial visualization test improvement increased from 18% in 2014 to 39% in 2017, while the percentage of students demonstrating significant improvement increased from 46% to 82%.
2014 → 2017
18% → 39%
Average pre/post test improvement
46% → 82%
Students demonstrating significant improvement
What I Learned
Design for the learning behavior, not just the interface.
This project changed how I thought about educational product design. The submission data showed that students' interactions with an interface could influence how they approached learning itself.
Rather than simply making Spatial Vis easier to use, I designed the experience to encourage behaviors associated with stronger outcomes: persistence, independent problem solving, and strategic use of help.
It also reinforced the value of combining quantitative product data with close examination of student work. Knowing where students struggled was useful; understanding how they struggled helped me design better support.
What happened next
The star system successfully encouraged persistence, but as Spatial Vis grew, I discovered an unintended consequence: some students became so motivated to preserve their stars that they refused to use help even when they needed it.